2026 Take-Home Pay by State at $50k, $75k and $100k Salaries
Last verified 2026-11-02 · Sources: IRS Publication 15-T (2026), Federal Income Tax Withholding Methods + IRS Publication 15 (2026), Employer's Tax Guide + Social Security Administration, Contribution and Benefit Base (2026) · Report an error
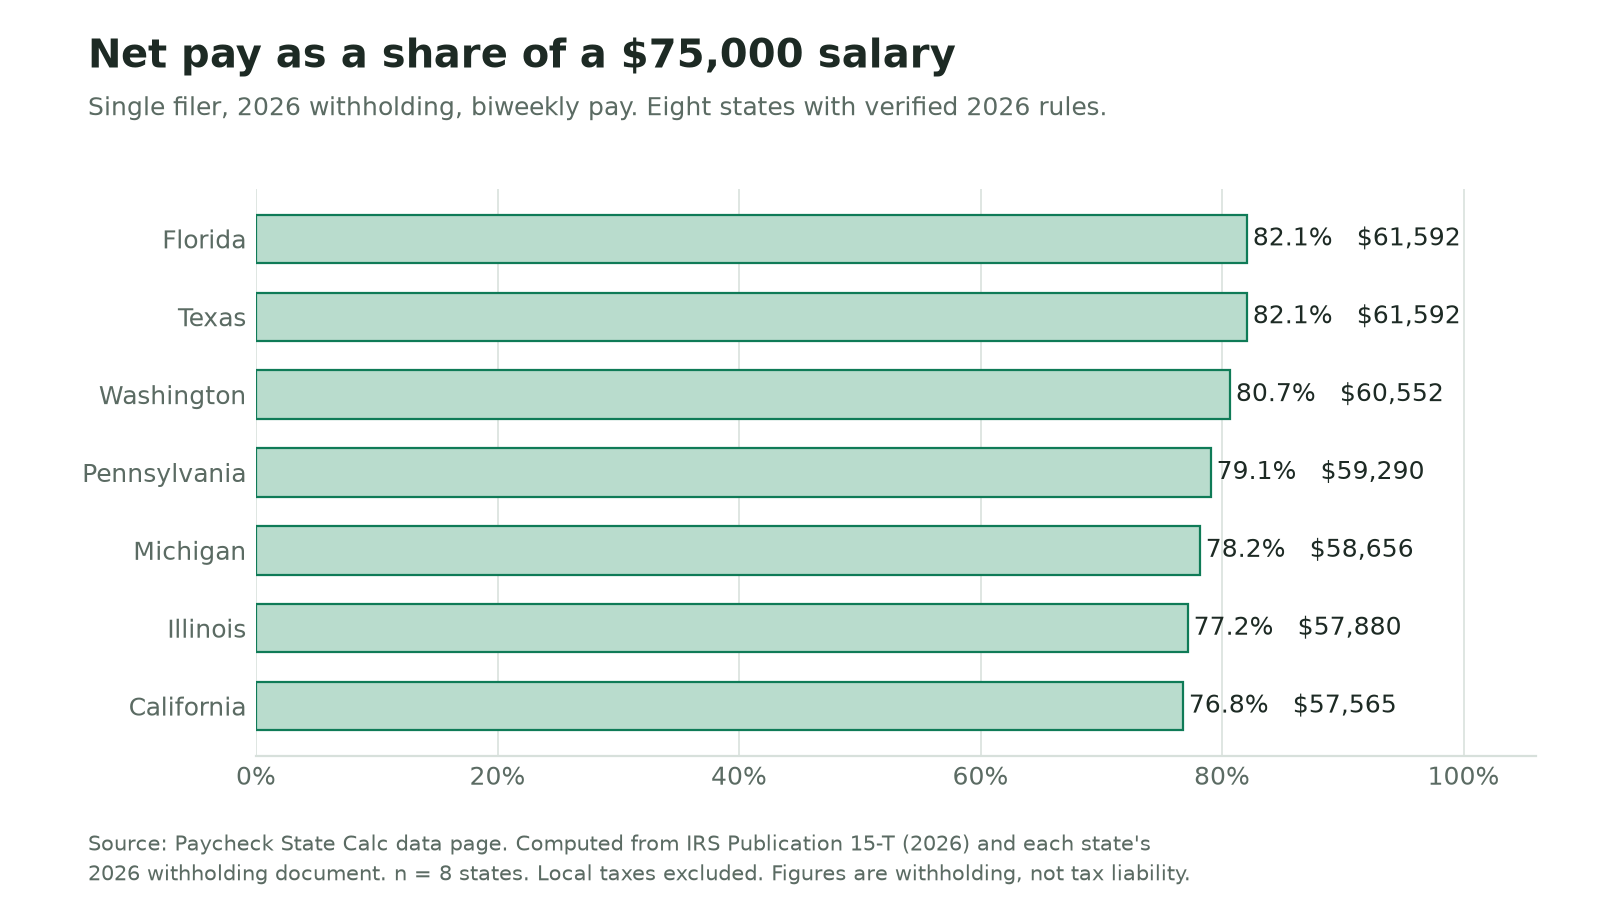
A single filer on $75,000 keeps 76.8% of gross pay in California and 82.1% in Florida and Texas, under the 2026 federal and state withholding rules this site has verified. This page publishes the full set of 42 computed rows for 7 states, three salaries and both filing statuses.
What the data shows
Florida and Texas have no income tax on wages, so their workers keep the same share at every salary once the federal side is fixed. Washington also levies no income tax on wages, and still lands below them at 80.7% versus 82.1% at $75,000, because the state's paid family and medical leave premium and the WA Cares contribution are withheld from pay.
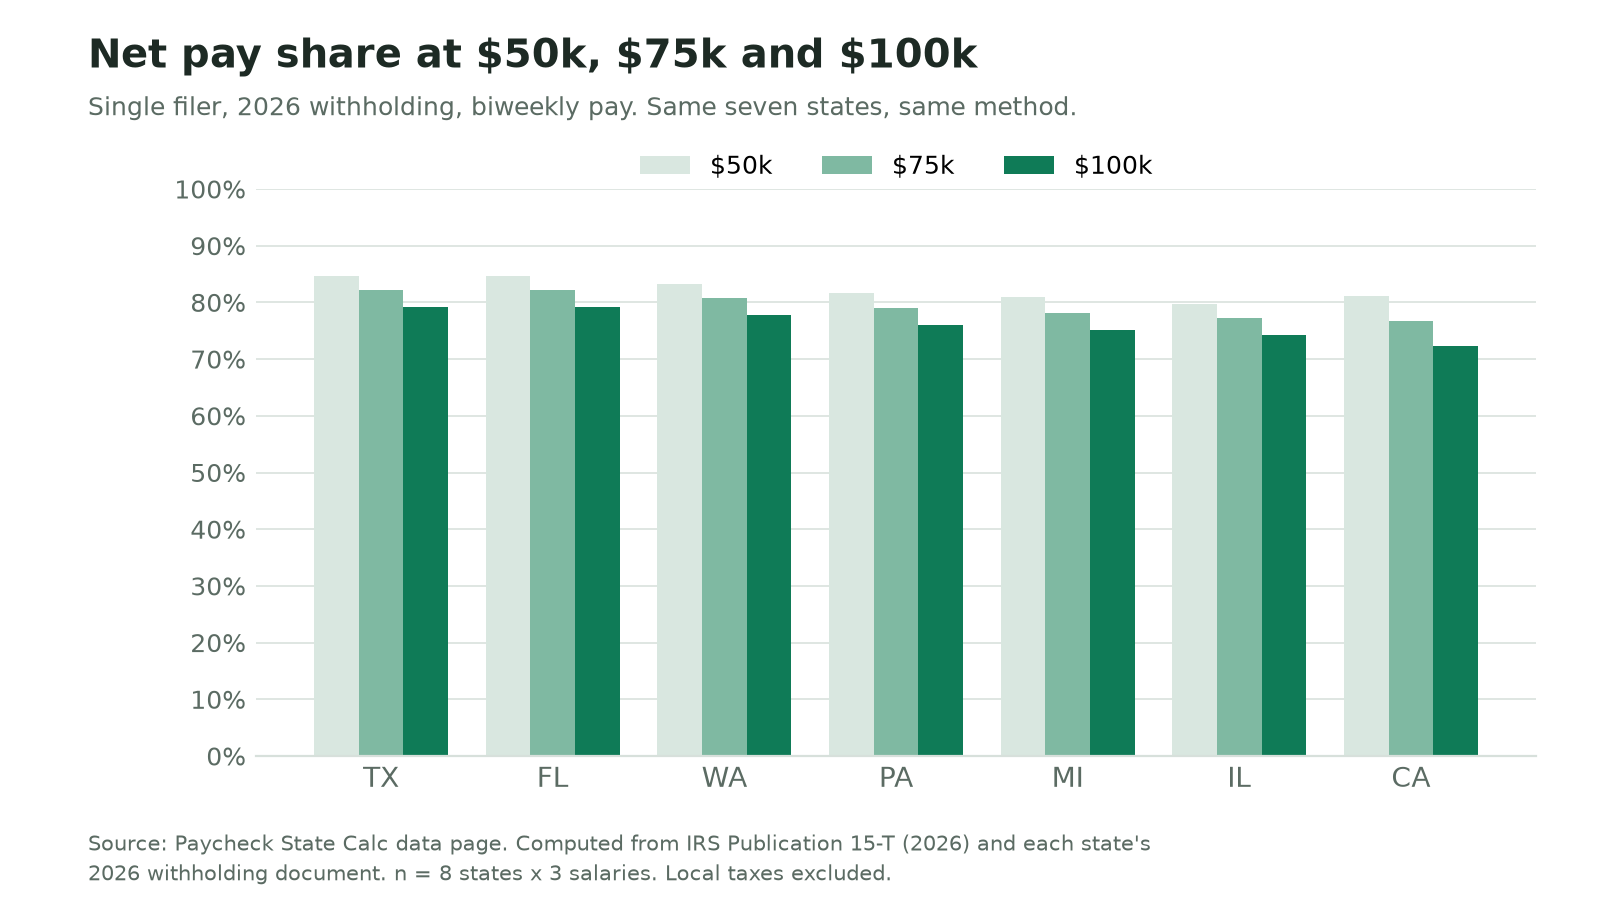
The spread between the highest and the lowest state grows with salary. At $50,000 the range is 79.8% (Illinois) to 84.7% (Texas and Florida); at $100,000 it is 72.3% (California) to 79.2% (Texas and Florida). In dollars, the $75,000 single filer in the highest state takes home $4,027 more than the same earner in the lowest state.
Married filing jointly keeps a higher share than single at the same salary in every row of this dataset, because the federal brackets are twice as wide while the household's income is compared with the same standard deduction structure.
Net pay as a share of gross
Three salaries, same method
Every row
42 rows: 7 states × 3 salaries × 2 filing statuses. Annual dollars are the biweekly amount multiplied by 26 and shown to the nearest dollar; the CSV carries cents. A dash is not used in this table: every cell is computed.
| State | Filing status | Salary | Federal | Social Security | Medicare | State income tax | State payroll | Net annual | Net % |
|---|---|---|---|---|---|---|---|---|---|
| Texas | Single | $50,000 | $3,822 | $3,100 | $725 | $0 | $0 | $42,353 | 84.7% |
| Texas | Single | $75,000 | $7,670 | $4,650 | $1,088 | $0 | $0 | $61,592 | 82.1% |
| Texas | Single | $100,000 | $13,182 | $6,200 | $1,450 | $0 | $0 | $79,168 | 79.2% |
| Texas | Married, jointly | $50,000 | $1,768 | $3,100 | $725 | $0 | $0 | $44,407 | 88.8% |
| Texas | Married, jointly | $75,000 | $4,628 | $4,650 | $1,088 | $0 | $0 | $64,634 | 86.2% |
| Texas | Married, jointly | $100,000 | $7,644 | $6,200 | $1,450 | $0 | $0 | $84,706 | 84.7% |
| Florida | Single | $50,000 | $3,822 | $3,100 | $725 | $0 | $0 | $42,353 | 84.7% |
| Florida | Single | $75,000 | $7,670 | $4,650 | $1,088 | $0 | $0 | $61,592 | 82.1% |
| Florida | Single | $100,000 | $13,182 | $6,200 | $1,450 | $0 | $0 | $79,168 | 79.2% |
| Florida | Married, jointly | $50,000 | $1,768 | $3,100 | $725 | $0 | $0 | $44,407 | 88.8% |
| Florida | Married, jointly | $75,000 | $4,628 | $4,650 | $1,088 | $0 | $0 | $64,634 | 86.2% |
| Florida | Married, jointly | $100,000 | $7,644 | $6,200 | $1,450 | $0 | $0 | $84,706 | 84.7% |
| Washington | Single | $50,000 | $3,822 | $3,100 | $725 | $0 | $693 | $41,660 | 83.3% |
| Washington | Single | $75,000 | $7,670 | $4,650 | $1,088 | $0 | $1,040 | $60,552 | 80.7% |
| Washington | Single | $100,000 | $13,182 | $6,200 | $1,450 | $0 | $1,387 | $77,781 | 77.8% |
| Washington | Married, jointly | $50,000 | $1,768 | $3,100 | $725 | $0 | $693 | $43,714 | 87.4% |
| Washington | Married, jointly | $75,000 | $4,628 | $4,650 | $1,088 | $0 | $1,040 | $63,594 | 84.8% |
| Washington | Married, jointly | $100,000 | $7,644 | $6,200 | $1,450 | $0 | $1,387 | $83,319 | 83.3% |
| Pennsylvania | Single | $50,000 | $3,822 | $3,100 | $725 | $1,535 | $0 | $40,818 | 81.6% |
| Pennsylvania | Single | $75,000 | $7,670 | $4,650 | $1,088 | $2,303 | $0 | $59,290 | 79.1% |
| Pennsylvania | Single | $100,000 | $13,182 | $6,200 | $1,450 | $3,070 | $0 | $76,098 | 76.1% |
| Pennsylvania | Married, jointly | $50,000 | $1,768 | $3,100 | $725 | $1,535 | $0 | $42,872 | 85.7% |
| Pennsylvania | Married, jointly | $75,000 | $4,628 | $4,650 | $1,088 | $2,303 | $0 | $62,332 | 83.1% |
| Pennsylvania | Married, jointly | $100,000 | $7,644 | $6,200 | $1,450 | $3,070 | $0 | $81,636 | 81.6% |
| Michigan | Single | $50,000 | $3,822 | $3,100 | $725 | $1,874 | $0 | $40,479 | 81.0% |
| Michigan | Single | $75,000 | $7,670 | $4,650 | $1,088 | $2,937 | $0 | $58,656 | 78.2% |
| Michigan | Single | $100,000 | $13,182 | $6,200 | $1,450 | $3,999 | $0 | $75,169 | 75.2% |
| Michigan | Married, jointly | $50,000 | $1,768 | $3,100 | $725 | $1,874 | $0 | $42,533 | 85.1% |
| Michigan | Married, jointly | $75,000 | $4,628 | $4,650 | $1,088 | $2,937 | $0 | $61,698 | 82.3% |
| Michigan | Married, jointly | $100,000 | $7,644 | $6,200 | $1,450 | $3,999 | $0 | $80,707 | 80.7% |
| Illinois | Single | $50,000 | $3,822 | $3,100 | $725 | $2,475 | $0 | $39,878 | 79.8% |
| Illinois | Single | $75,000 | $7,670 | $4,650 | $1,088 | $3,713 | $0 | $57,880 | 77.2% |
| Illinois | Single | $100,000 | $13,182 | $6,200 | $1,450 | $4,950 | $0 | $74,218 | 74.2% |
| Illinois | Married, jointly | $50,000 | $1,768 | $3,100 | $725 | $2,475 | $0 | $41,932 | 83.9% |
| Illinois | Married, jointly | $75,000 | $4,628 | $4,650 | $1,088 | $3,713 | $0 | $60,922 | 81.2% |
| Illinois | Married, jointly | $100,000 | $7,644 | $6,200 | $1,450 | $4,950 | $0 | $79,756 | 79.8% |
| California | Single | $50,000 | $3,822 | $3,100 | $725 | $1,143 | $650 | $40,560 | 81.1% |
| California | Single | $75,000 | $7,670 | $4,650 | $1,088 | $3,052 | $975 | $57,565 | 76.8% |
| California | Single | $100,000 | $13,182 | $6,200 | $1,450 | $5,560 | $1,300 | $72,308 | 72.3% |
| California | Married, jointly | $50,000 | $1,768 | $3,100 | $725 | $562 | $650 | $43,195 | 86.4% |
| California | Married, jointly | $75,000 | $4,628 | $4,650 | $1,088 | $1,481 | $975 | $62,178 | 82.9% |
| California | Married, jointly | $100,000 | $7,644 | $6,200 | $1,450 | $2,832 | $1,300 | $80,574 | 80.6% |
Rows are ordered by each state's net share at $75,000 single, highest first. A row's components can add up to a few cents more than the stated salary: the biweekly gross is rounded to the cent before withholding is computed, then multiplied back to a year. The method section states this in full.
Download the data
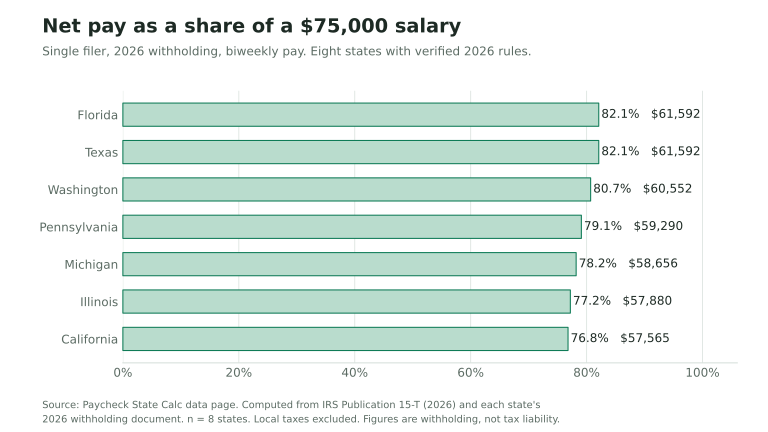
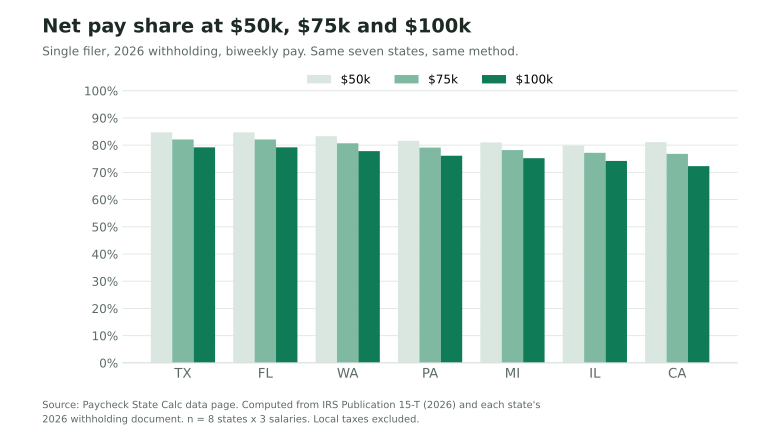
Both charts are rendered from data.csv and the table is built from the same
rows, so the numbers in a figure, a table cell and a download cannot disagree.
Method
Scenarios
- Filing status: single, and married filing jointly.
- Salary: $50,000, $75,000 and $100,000 a year, paid biweekly (26 periods).
- No pre-tax deductions: no 401(k), no Section 125 health premium, no HSA contribution.
- 2020-or-later Form W-4 with no adjustments: no dependent credits, no other income, no extra withholding.
- One employer for the whole year, so the Social Security wage base is applied once.
What each row contains
- Federal income tax withholding, from the percentage-method tables in IRS Publication 15-T for 2026.
- Social Security at the employee rate on wages up to the annual wage base, and Medicare at the employee rate on all wages, including the additional Medicare tax above the 2026 threshold.
- State income tax withholding under each state's own 2026 method: California Method B, Illinois IL-700-T, Michigan's annualised flat-rate method, Pennsylvania's flat rate, and zero in Texas, Florida and Washington.
- State payroll contributions where the state has one: California SDI at the employee rate, and Washington's Paid Family & Medical Leave premium plus the WA Cares contribution. The WA Cares figure assumes a worker who is not exempt; the calculator has a switch for exempt workers.
Excluded, stated rather than modelled
- Local income taxes: Detroit and other Michigan city taxes, and Pennsylvania local earned income tax.
- New York is not in this version. It will be added after its withholding brackets are re-computed one by one, and that row will exclude New York City and Yonkers local tax.
- Pre-tax deductions, wage garnishments, mid-year raises, job changes, multi-state work and supplemental pay.
- State disability programmes other than California's, and any city or county payroll tax.
Rounding and reconciliation
Each biweekly gross is rounded to the cent before withholding is computed, as a payroll system does. The annual figures are that per-period amount × 26. Annual net as a share of gross is rounded to 0.1 percentage point, and dollars in the table are rounded to the nearest dollar. Because of the per-period rounding, a row's five withholding lines plus its net pay can add up to a few cents more than the salary shown.
Withholding, not tax liability
These are withholding amounts, not final tax liability: a filed return settles the difference, and a refund or a balance due is outside what a paycheck model can state.
Coverage and verification
Coverage is 7 of 50 states plus DC, and no national average is claimed while coverage is partial. Georgia is excluded: its 2026 rate and standard deduction are verified, but the withholding formula is not, so the engine refuses to compute a Georgia row. Each state's row is included only when every rule block behind it carries a verified status in that state's data file. The engine that produces these rows is the same one the calculator runs, and a parity test holds the browser implementation to the Python implementation on 1,630 cases.
Sources
Every row names its sources in the source_ids column of the CSV. Accessed 2026-10-30; the
figures were recomputed and re-checked on 2026-11-02.
irs_p15t— IRS Publication 15-T (2026), Federal Income Tax Withholding Methods — https://www.irs.gov/publications/p15t — accessed 2026-10-30irs_p15— IRS Publication 15 (2026), Employer's Tax Guide — https://www.irs.gov/publications/p15 — accessed 2026-10-30ssa_cbb— Social Security Administration, Contribution and Benefit Base (2026) — https://www.ssa.gov/oact/cola/cbb.html — accessed 2026-10-30tx_constitution— Texas Constitution, Article VIII, Section 24 — prohibition on a net income tax — https://statutes.capitol.texas.gov/Docs/CN/htm/CN.8.htm — accessed 2026-10-30tx_comptroller— Texas Comptroller — taxes — https://comptroller.texas.gov/taxes/ — accessed 2026-10-30wa_esd_pfml— ESD news release — Paid Family & Medical Leave premium rate increases to 1.13% in 2026 — https://esd.wa.gov/about-us/news-release/2025/paid-family-medical-leave-premium-rate-increases-113-2026 — accessed 2026-10-30wa_paidleave— Washington State Paid Family & Medical Leave — premium rates — https://paidleave.wa.gov/updates/ — accessed 2026-10-30wa_cares— WA Cares Fund — how it works — https://wacaresfund.wa.gov/how-it-works — accessed 2026-10-30mi_rate_notice— Michigan Department of Treasury — 4.25% Income Tax Rate for Individuals and Fiduciaries in 2026 Tax Year — https://www.michigan.gov/treasury/reference/taxpayer-notices/2026/04/15/425-income-tax-rate-for-individuals-and-fiduciaries-in-2026-tax-year — accessed 2026-10-30mi_withholding_year— Michigan Department of Treasury — Withholding Tax Information by Calendar Year (2026 rate and personal exemption) — https://www.michigan.gov/taxes/business-taxes/withholding/calendar-year-tax-information — accessed 2026-10-30mi_446— Michigan Income Tax Withholding Guide (Form 446), 2026 — https://www.michigan.gov/taxes/-/media/Project/Websites/taxes/Forms/SUW/TY2026/446_Withholding-Guide_2026.pdf — accessed 2026-10-30fl_constitution— Florida Constitution, Article VII, Section 5 — Estate, inheritance, and income taxes — https://www.flsenate.gov/Laws/Constitution — accessed 2026-10-30il_700t— Illinois Department of Revenue — 2026 IL-700-T, Illinois Withholding Tax Tables — https://tax.illinois.gov/forms/withholding/currentyear/il-700-t-withholding-guide-tables.html — accessed 2026-10-30pa_rates— Pennsylvania Department of Revenue — Tax Rates — https://www.revenue.pa.gov/Tax%20Rates/Pages/default.aspx — accessed 2026-10-30pa_pit— Pennsylvania Department of Revenue — Personal Income Tax — https://www.revenue.pa.gov/TaxTypes/PIT/Pages/default.aspx — accessed 2026-10-30ca_de44— California EDD — California Employer's Guide 2026, DE 44 Rev. 52 (4-26), Method B Exact Calculation Method — https://edd.ca.gov/siteassets/files/pdf_pub_ctr/de44.pdf — accessed 2026-10-30ca_de3395— California EDD — DE 3395, tax rates and wage limits — https://edd.ca.gov/siteassets/files/pdf_pub_ctr/de3395.pdf — accessed 2026-10-30
Cite this page
License: the CSV and charts are published under CC BY 4.0. Credit Paycheck State Calc and link to this page. Suggested citation:
Paycheck State Calc. "2026 Take-Home Pay by State at $50k, $75k and $100k Salaries." November 2026. https://paycheckstatecalc.com/data/take-home-pay-by-state-2026/
Embed code, with the campaign tags the site uses for every outbound link:
<a href="https://paycheckstatecalc.com/data/take-home-pay-by-state-2026/?utm_source=embed&utm_medium=referral&utm_campaign=data_asset&utm_content=take-home-pay-by-state-2026">
<img src="https://paycheckstatecalc.com/data/take-home-pay-by-state-2026/chart.png" alt="Net pay as a share of a $75,000 salary, seven states, 2026" width="800"></a>
<p>Source: <a href="https://paycheckstatecalc.com/data/take-home-pay-by-state-2026/?utm_source=embed&utm_medium=referral&utm_campaign=data_asset&utm_content=take-home-pay-by-state-2026">Paycheck State Calc</a></p>
Changelog
| Date | Change |
|---|---|
| 2026-11-02 | First publication. 42 rows for 7 states at three salaries and two filing statuses, with CSV, two charts and the source list above. |
Last updated: 2026-11-02